
Enhance Reliability Engineer Productivity with Context
In Asset Management a key method to identify improvement opportunities and track the progress of refinements is by evaluating the data from your business systems.
There are a variety of data elements that can be leveraged to drive asset management programs with most organizations focusing on information from the following areas:
- What are my assets and where are they located.
- What are my assets worth (how critical are they to my operation).
- What condition are they in.
- What is my plan to maintain, inspect and monitor the assets.
- What maintenance, inspection and monitoring activities have been performed on my assets.
- What did we learn when we maintained, inspected, repaired, and monitored my assets.
With the maturing of technologies in the industrial space, we are now seeing more organizations which have solved the foundational challenges of data collection and integration of various asset data sources. Enterprise systems such as Enterprise Resource Management (ERP), Enterprise Asset Management (EAM), Process Historians as well as IT/OT integration solutions coupled with the concept of Data Lakes now ensure access to core asset information for resources in engineering, maintenance, operations, and reliability functions. With this evolution new questions now emerge about the optimal approach to present the data to ensure stakeholders can quickly view and interpret the data to make timely decisions which positively impact the business. An illustration of this came from a recent conversation we were having with a customer where they used a fishing analogy:
“Yes, we have a Data Lake which has pulled all the information together. Our challenge is we are in a large body of water with a rowboat trying to catch a trophy fish! What we need now is a fast boat with a fish finder to win the tournament, do you have one of those?”
In this article, we will explore approaches which are utilized to deliver data to asset managers to support their quest to optimize performance & cost and risk. We have a philosophy at Itus Digital, people are the most valuable asset at any manufacturing facility – their knowledge, decisions and actions are what ultimately produce a product at an optimal rate and cost profile.
Unfortunately, our industrial workforce is shrinking, and we are experiencing an unprecedented loss of knowledge as baby boomers retire. Analyzing and presenting asset information in the most efficient and effective manner is more important than ever. We also have a challenge on the opposite side of this issue, our new generation of engineer’s have grown up with iPhones and apps and expect to consume data in a completely different way. They want information to be served in a complete ‘context’, in real time, wherever they are on whatever device they use. Meeting these expectations is key to driving optimization and continuous improvement with our next generation of asset managers.
Business Intelligence is a starting point
The concept of business intelligence (BI) has been around for a long time but really started gaining momentum in the early 2000’s as enterprise solutions consolidated business processes and data into common systems. One of the cornerstones of BI is presenting complied information into Dashboards that stakeholders can access to view standardized metrics and results.
A very common example in asset management is below, a Pareto analysis of asset repair costs. In the simplest form it is the aggregate summation of repair costs, sorted descending for some asset population over a period of time.
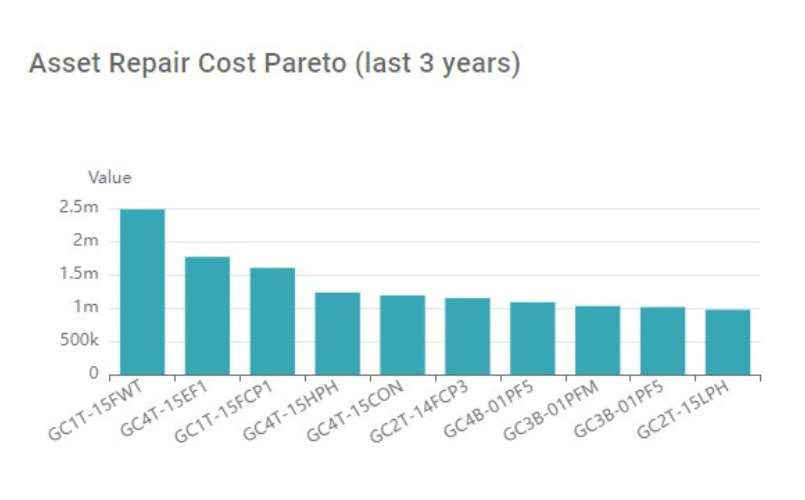
By accessing this information, a Maintenance Manager or Reliability engineer gets foundational insights on the assets driving the most repair cost which can be the basis for improvement initiatives.
Dashboards which pull together core information and insights are a great starting point. They provide a common location and view of standardized metrics which can drive decision-making. Many, such as Microsoft’s Power BI, also provide nice capabilities to filter, sort and pivot the information allowing for refinement of the data and analysis.
However, there are some limitations with traditional BI analytical approaches. One issue is BI implementations tend to be ‘passive’ and require an analyst to go hunt and search for information to identify a problem. Given how busy resources are within industrial facilities, sometimes the simple process of accessing an application, logging in and then finding the outlier in the chart, is enough to prevent the problem-solving process. Another core challenge with BI and Dashboards, they usually do not drive the process to act and solve the identified problem. The objective of the dashboard is to present data. If you want to act, you must move to other applications to invoke improvement processes and creation of tangible value. We find that the most effective use of dashboards tends to be with standardized metrics that do not require close interval evaluation or rapid response. A couple examples of these include bad actor reports, monthly maintenance spend, and weekly downtime hours by operating unit.
Purpose Built Apps Provide More Context
Today, most software applications are designed to meet very specific objectives and in the industrial segment we now have many categories of purpose-built solutions. EAM solutions track assets and manage maintenance activities. Process historians collect, aggregate and store massive volumes of time series data. Asset Performance Management (APM) solutions analyze maintenance and operating histories to identify poor performing assets and drive corrective actions to mitigate failure risk.
Modern solutions in these solution categories are now offering very specific and compelling context based upon their purpose. When designed appropriately, these apps offer asset managers the right information, at the right time in the most appropriate context to solve the problem. The following example from the Itus APM solution highlights the value of full context for a centrifugal pump under management. In the Itus solution, users can define specific watchlists which contain the assets they manage or want to monitor closely, and each asset has its own watchlist card.
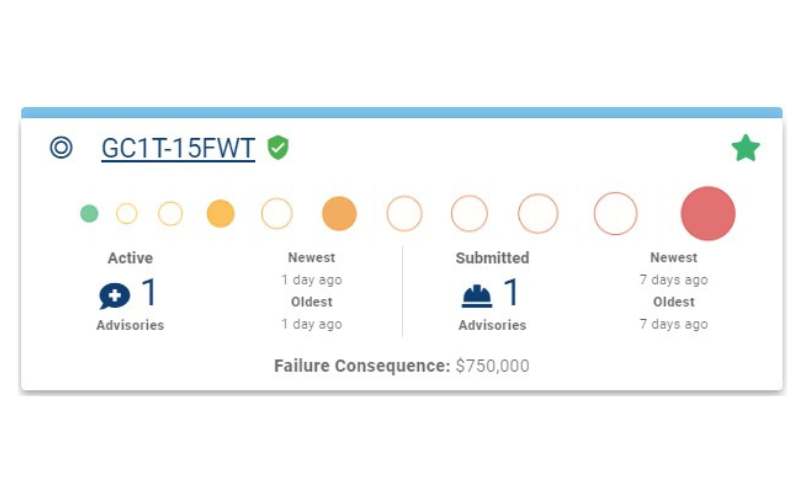
The watchlist card is designed to provide complete context of the current asset strategy and health in a simple and intuitive view. From this one card, we see a high-risk asset ($750,000 failure consequence) with a high severity condition (elevated vibration and temperature on the Bearing) which was generated 1 day ago. I can also see we have a submitted corrective action which is 7 days old.
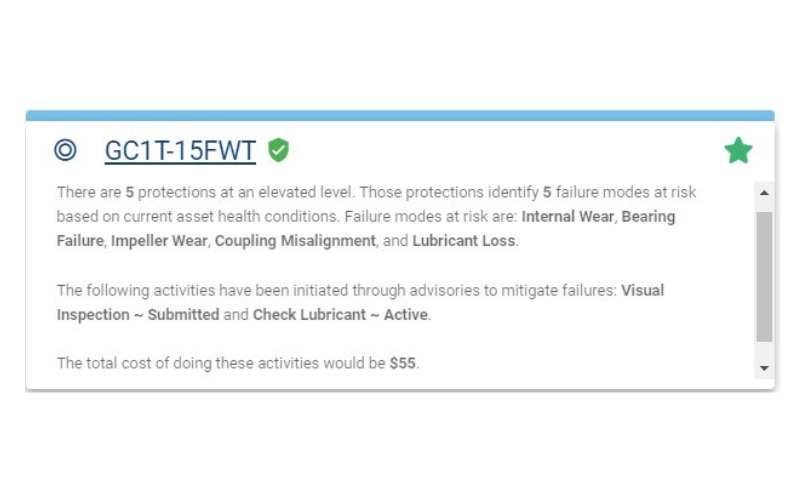
If you are not into interpreting icons and colors, simply flip the card over to get the full narrative which specifies at risk failure modes and indicates for $55 we can inspect and lubricate the pump to mitigate the potential failure.
Let’s compare that with our previous BI example. The dashboard did inform me that this particular pump is my bad actor from the repair cost perspective, which is a great start. However, purpose-built apps can provide much richer context and therefore more timely and accurate mitigation and business benefit. With full context, I know the risk associated with failure, what failure modes/threats are currently active and whether action has been taken to address the problem. Just as important, I am one click away from escalation or additional action as needed based upon the context.
Real Time Exception Management Is The New Norm
In the consumer markets, Smartphones, Tablets and Apps have fundamentally shifted the expectations for how people get, interact with and act on information. Let’s take a simple example of going on a family vacation or business trip in a car. Not that long ago you would need to get a map, find your start and end points and then document your directions from point A to B. If you encountered a closed road, accident or high traffic volume while traveling you would just have to accept the consequences and/or start the mapping process over. Map applications on smartphones have completely shifted how most of us travel from point A to B. They are purpose built with full context AND provide real time notifications and recommendations when conditions such as high traffic have rendered your original route as less than optimal. Most importantly, they simplify an old process and generate new value – optimal travel time based upon current conditions.
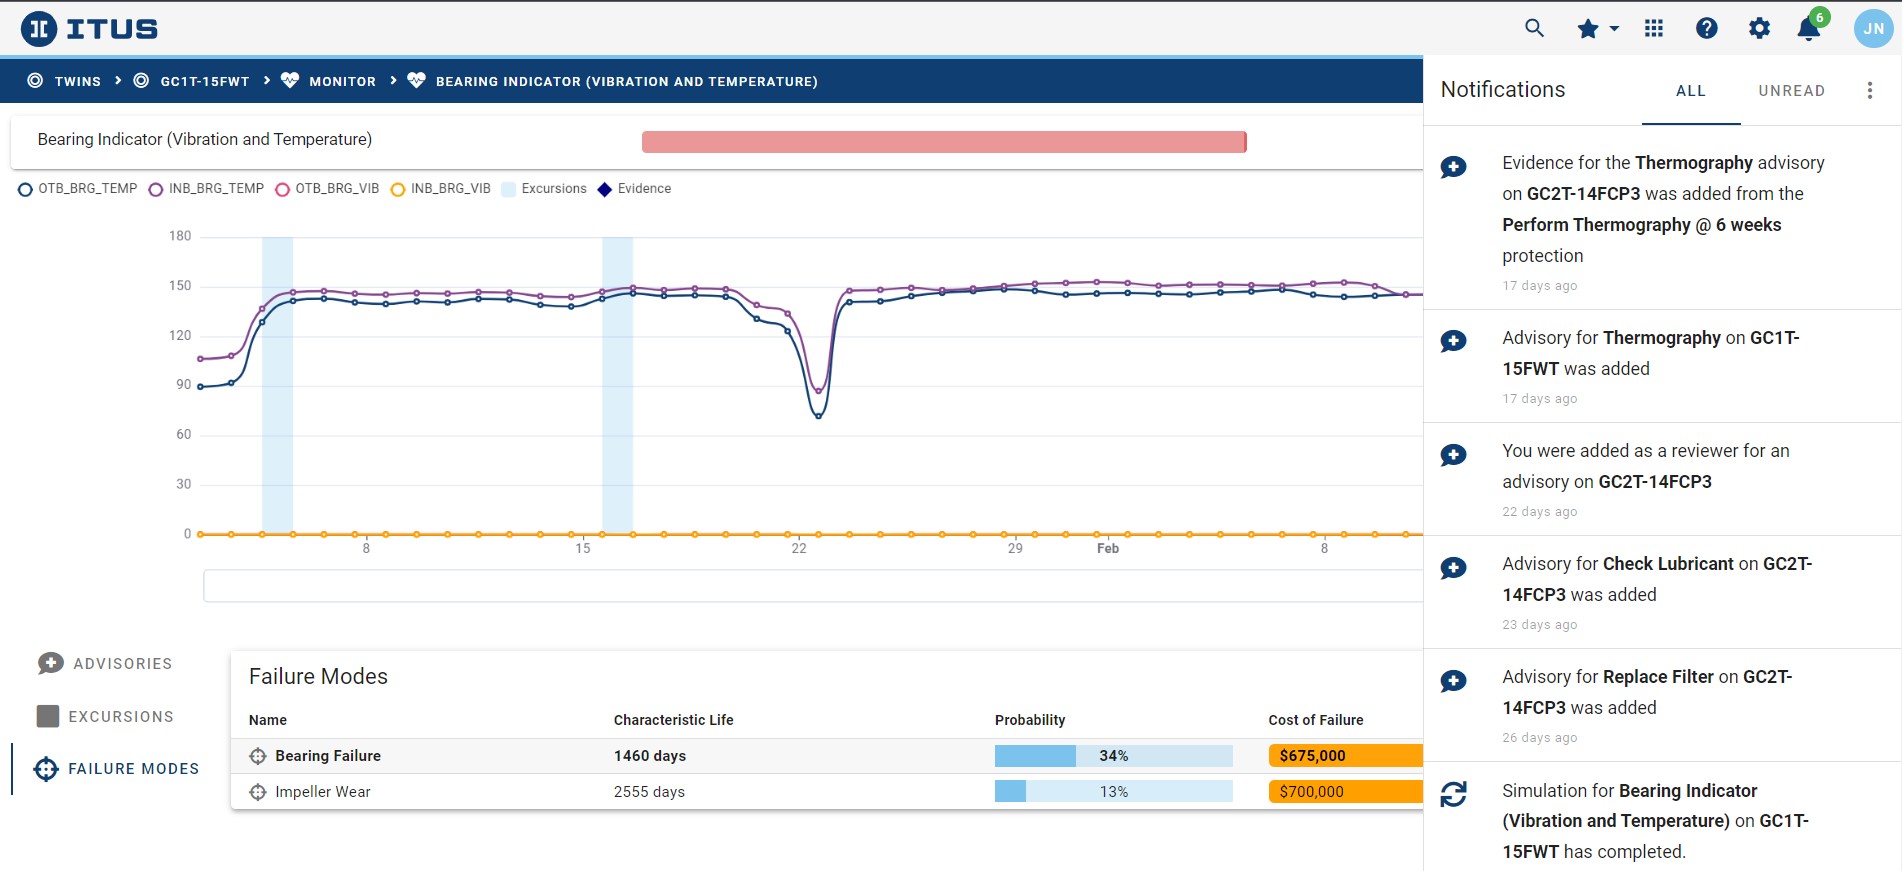
Fortunately, industrial applications are learning from the consumer markets and building capabilities to deliver the right information at the right time, to the right place in a prescriptive fashion. When designed correctly modern apps already know what you need to know and enable you to opt-in to that information in real time. The following example is also from the Itus APM solution and demonstrates some of these key capabilities.
First, the application already knows what a Reliability Engineer wants to know. For example:
- Is an asset in poor health?
- Have we taken corrective action?
- Is a known failure risk emerging?
- Has a new failure mode emerged?
- Are we executing the recommended maintenance?
- Has the asset strategy changed?
- Has the MTBF changed?
Next the Reliability Engineer can quickly opt-in to the information based upon their specific needs and preferences:
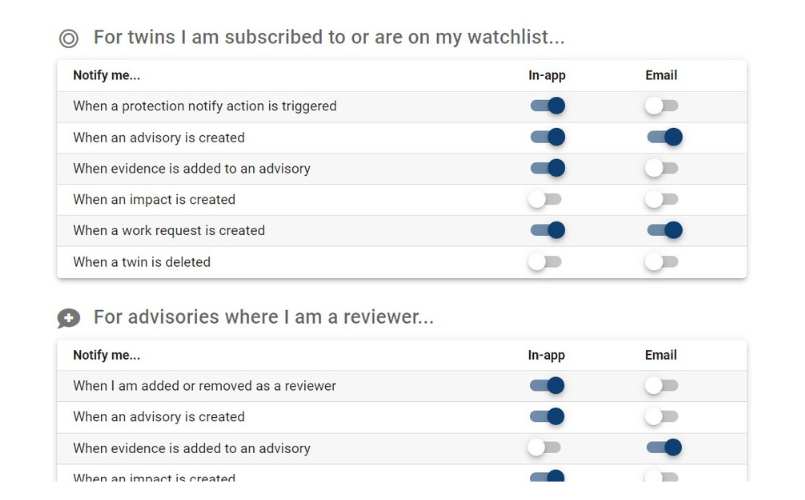
Finally, the application delivers the information in real time, in complete context with prescriptive recommendations:
The advantage of this analytical approach is clear. No need to spend valuable time hunting through volumes of information to find an exception that needs to be managed further. We often hear that Reliability Engineers spend 80% of their time gathering data and only 20% of their time analyzing data. With an intelligent and exception-based model, this ratio can easily be flipped. Simply tell the application what you want to know and let it do the work based upon current conditions.
Data management and analysis are foundational processes when managing industrial assets. How data is consumed and presented are key considerations when looking to maximize subject matter expert time and effectiveness of decision making. Modern technologies are solving for the classic challenges of data gathering and integration which is now driving focus on how data is delivered, visualized, and analyzed for maximum business impact. As you design your asset management program, carefully consider what analytical approaches you are putting in place and work to drive full context, timely delivery, and integrated models to drive mitigating actions.
The team at Itus Digital have been building and deploying analytical solutions with industrial organizations for the last 25 years. If you would like to chat about analytics or learn more about our solutions, connect with us here.