
Confessions of an Old School Risk Matrix Zealot
Webster’s Dictionary defines risk as the “possibility of loss or injury”. ISO 31000 defines a risk matrix as “a tool for ranking and displaying risks by defining ranges of consequences and likelihood”. With these two definitions you can simply define a risk matrix like the example below:
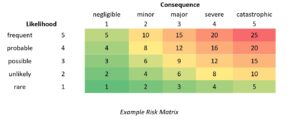
The problem with this simple approach is context. Can it really be said with confidence that a rare but catastrophic event is as low a risk as a negligible but frequent event? No, because the matrix above lacks meaningful context. I’ve learned that different risk contexts require different risk visualizations.
I used to think that a risk matrix was the ultimate tool in evaluating criticality and risk for asset management. I used to think that all categories of risk could be evaluated congruently in a common risk matrix across an organization. In my past, I even led an entire product line of asset management tools upon this principle, thus forcing many subject matter experts in asset reliability, mechanical integrity, and process safety to attempt to align to a common risk matrix. Those were some very spirited discussions usually turning into debates, with alignment not always the result. As William Blake once said, “The fool who persists in his folly will become wise.” Indeed, I have learned this lesson, with age and experience comes wisdom and humility.
In my defense, the risk matrix is a very good tool. It provides a visual representation to communicate risk concepts simply while providing a framework for prioritization. It can be customized for specific organizations with specific definitions of risk. It is no wonder industry so quickly wants to adopt it to understand risk across our organizations. Unfortunately, it is not a good tool for comprehensive risk quantification, nor its mitigation. It is limited to discrete ranges of probability and consequence. It is often over-simplified, subjectively qualitative and does not consider how risk changes over time.
Let’s consider a couple of common categories of risk in asset intensive industry – Safety and Operations.
First and foremost, let’s discuss Safety risks which are focused on consequences from minor injury up to very severe injury, including fatality. Naturally, the protection of people is of utmost importance. A safety risk assessment considers events that could lead to personnel harm or injury. For example, could the event occur, can the event cause a chemical leak and/or fire, and is there a possibility that someone could be exposed to the leak or fire. When determining a risk matrix, the consequence categories can scale reasonably from “minor first aid” to “fatality”. But in this context our probability scale actually factors in multiple probabilities for every row (i.e. event, leak, fire, and exposure). Thus, the matrix probability could exponentially scale from an occurrence of once per year to an occurrence of once every 10,000 years. It can be difficult to practically understand something occurring only once every 10,000 years, but this makes total sense to a safety engineer or likewise to a mechanical integrity engineer. They are responsible for mitigating severe consequences that should never happen which include fatality, loss of containment, fire, and hazards to the environment.
Safety and integrity engineers use methods of risk mitigation dictated by process safety management standards such as Hazards Analysis, Safety Integrity Systems (SIS), Layers of Protection Analysis (LOPA), Risk Based Inspection (RBI) as well as compliance to jurisdictional standards. These methods are relatively complex methodologies that drive recommended and mandatory actions as part of an overall safety and integrity plan. While you can use a risk matrix as a visual representation of the result these methods, you cannot easily use the same risk matrix to represent what I will next call Operational risk.
For the context of this article, I define Operational risk as the risk of unplanned production downtime and associated costs, which may include maintenance, overtime, lost production, rework, and scrap. Often unplanned production downtime is caused by asset failures. Reliability engineers seek to mitigate the risk of these asset failures, especially those that impact production. There is typically an immediate cause and effect of a critical production asset failure. The asset fails and production is immediately impacted. Imagine assets that failed every 10,000 years, reliability engineers would not be needed to determine how to improve those failure rates! That is the difference of probability scale for a reliability engineer. They are dealing with asset failure consequences of production loss and costs which could occur multiple times a year up to once every several years. It is a completely different context to that of the Safety or Integrity engineer.
Thus, I have learned that a risk matrix is just a defined set of intersections of probability and consequence chosen to represent a category or context for risk. As described above, contexts for Safety and Operations are different, thus it is reasonable for risk matrices to differ. Remember it is a tool for visualization and prioritization more than assessment and mitigation.
Back to the reliability engineer focused on Operational risks, there is another key aspect to consider for risk assessment that I call “mission time”. The mission time for an asset or a group of assets, such as a production unit, can be thought as the time between major shutdown events where restorative maintenance or asset replacement is performed. If a risk matrix is used to assess risk in this context, the assessment will be limited to just the ranges defined for each intersection and it will not have any context of risk over time.
For the reliability engineer it is best to assess risk with a more quantitative probability estimate over a mission time multiplied by an estimate of the overall cost of the potential failure to the business. This allows the engineer to focus improvement efforts on the assets that will return the most value to the business. These include efforts leveraging reliability methodologies such as failure mode-based strategy development, maintenance optimization, reliability modeling, asset health monitoring and advanced analytics.
A better risk assessment method is to estimate a failure probability quantitatively for the asset. This can easily be done with an estimate of failure rate experienced (or expected) combined with a desired mission time. A simple calculation can be used to represent the probability over time such as a random Weibull or exponential distribution. Plotting the distribution will provide a simple visual over time.
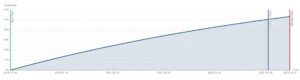
Consequence can also be estimated based on the overall cost of failure, which would include all costs including repair costs and production losses. Combining this cost-based consequence with our failure probability, overall risk for our mission time can be easily calculated.

Now if you have a set of production assets to evaluate for a system or unit, you could compare them across a mission time between shutdowns. A comparison might look like the chart below; note the riskiest asset is not always the one to focus on during the mission time.

Assets with a higher probability of failure but lower cost, might need more attention during the mission time than an Asset with a much lower probability of failure but much higher cost. This is a risk comparison tool to evaluate assets in a specific context over a specific time. Also, by estimating failure probability and cost of failure, you are better equipped to leverage other reliability methods to determine the best course of action to improve assets.
Now for those of you that have assessed asset criticality with a qualitative risk matrix approach, take heart because all is not lost. You are a step ahead. Consider your risk matrix intersection an initial assessment that can be leveraged in the more detailed assessment above. You can simply use your ranges as estimates of failure rates and costs to plug into the same formulae and then adjust as needed.
With this comparison, the next steps can be taken to mitigate risk and capture its associated value to the organization. There are several mitigation methods to improve an asset’s performance or reduce the cost of unplanned failures. These include addressing problems such as:
- The asset is unreliable with low inherent MTBF
- My asset strategy does not cover all failure modes
- My asset strategy does not effectively cover failure modes
- My asset strategy interval is too low (doing too much)
- My asset strategy interval is too high (doing too little)
- My asset strategy is not being executed properly
- My asset strategy is not addressing the root cause of the failures
In summary, remember an initial risk assessment is just the starting point to any form of active risk management. You must use the assessment to drive prioritization and improvement of asset performance in support of the operation of your business. A risk matrix is a tool that can be used, but we believe a quantitative approach is better. The better the assessment, the better decisions you will make regarding risk mitigation.
If you want to take your first, or next, steps to assess operational risk, we can help!
Register for our FREE Asset Risk Analyzer here and start managing and mitigating your risk in minutes!